
Demystifying Break-Even Calculations: A Beginner’s Guide to Understanding and Using a Break-Even Calculator
For any aspiring entrepreneur or seasoned business owner, the term “break-even point” often looms large, representing the elusive threshold where revenue finally equals costs. While it might sound like complex financial jargon, understanding and utilizing break-even calculations is a fundamental skill that underpins sound business strategy. This guide aims to demystify the break-even calculator, illuminating its inner workings and empowering individuals to leverage this powerful tool for informed decision-making.
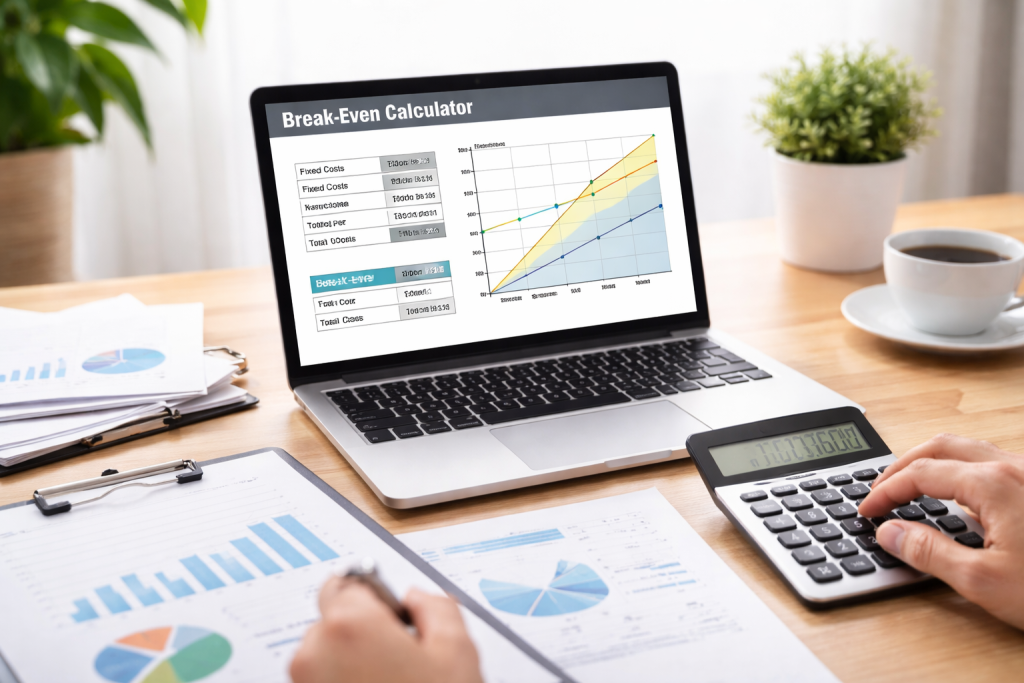
At its core, a break-even calculator is a financial instrument designed to determine the point at which a business’s total costs and total revenues are equal, meaning there is no net loss or gain. It answers the crucial question: how many units of a product or service must be sold, or how much revenue must be generated, to cover all expenses?
The Core Components of a Break-Even Calculator
The calculator operates on a simple yet profound formula: Fixed Costs / (Per-Unit Revenue – Per-Unit Variable Costs). Each element plays a critical role in the final calculation. Per-unit revenue, sometimes called the selling price per unit, is the amount of money a business earns from selling one single item or delivering one instance of a service. Costs that are directly related to making or delivering one unit, like raw materials or direct labor, are called per-unit variable costs. The difference between per-unit revenue and per-unit variable costs is known as the contribution margin per unit. This margin represents the amount of money from each sale that contributes toward covering fixed costs.
The Calculation Process Explained
Imagine a simple scenario: a small bakery selling custom cakes. The break-even calculator would take the total fixed costs (rent, insurance, and salaries not tied to production volume) and divide them by the contribution margin from each cake sold. The result would be the number of cakes the bakery needs to sell to cover all its expenses. Once the bakery reaches this number, each subsequent cake sale generates profit. The power of the calculator lies in its ability to bring clarity to this crucial financial benchmark, allowing businesses to set realistic goals and assess their viability.
A thorough grasp of fixed and variable costs is paramount to accurate break-even analysis. Misclassifying these expenses can lead to significantly skewed results and erroneous business decisions.
Defining Fixed Costs
Fixed costs are expenses that do not change regardless of the level of production or sales within a given period. These are typically recurring expenses that a business incurs even if it produces zero units. Examples include rent for an office or factory, insurance premiums, salaries of administrative staff, property taxes, and depreciation on equipment. These costs remain constant whether you sell one product or a thousand. Knowing their stability is crucial for establishing a baseline of expenses that need constant coverage.
Defining Variable Costs
Conversely, variable costs are expenses that fluctuate directly with the level of production or sales. The more units a business produces or sells, the higher its total variable costs will be. Common examples include raw materials, direct labor wages for production workers, packaging costs, and sales commissions. If a widget company produces twice as many widgets, their raw material costs and direct labor costs will likely double. Recognizing this direct correlation is important when predicting how expenses will scale with growth. Some costs can also be categorized as semi-variable costs, which have both a fixed and a variable component. For instance, a utility bill might have a fixed service charge plus a variable charge based on consumption. For break-even analysis, it’s often prudent to allocate the variable portion to variable costs and the fixed portion to fixed costs or, for simplicity in initial calculations, classify them based on their predominant nature.
For small businesses, where resources are often limited and every dollar counts, break-even analysis is not merely a theoretical exercise; it’s a vital survival tool. It provides a roadmap for financial stability and growth.
Assessing Business Viability
Before launching a new product or venture, a small business can use break-even analysis to determine if the idea is financially sound. If the break-even point is astronomically high, it might signal that the pricing is too low, the costs are too excessive, or the potential market is too small to justify the investment. This upfront assessment can prevent significant financial losses and wasted effort. It allows entrepreneurs to sanity-check their assumptions before committing substantial capital.
Setting Realistic Sales Targets
Understanding the break-even point empowers small business owners to set achievable sales targets. Instead of just “selling as much as possible,” they can aim for a specific number of units or revenue figure that ensures they cover their expenses. This clarity can motivate sales teams and provide a tangible goal to work toward. Knowing that selling 100 units covers all costs and anything beyond that is profit provides a powerful incentive.
Informing Pricing Decisions
Break-even analysis is critical when it comes to identifying optimal pricing strategies. If the break-even point is too high with the current pricing, a business might need to consider increasing its prices, assuming the market can bear it. Conversely, if the break-even point is comfortably low, there might be room to adjust prices for competitive reasons or to attract a larger customer base without jeopardizing profitability. It helps strike a balance between attracting customers and ensuring financial sustainability.
While many online break-even calculators automate the process, understanding the manual steps enhances comprehension and allows for critical evaluation of the results.
Identifying All Fixed Costs
The first and most critical step is to accurately identify and sum all fixed costs for a given period (e.g., monthly or annually). This requires meticulous review of financial statements and budgeting documents. Don’t overlook seemingly small but recurring expenses. A common pitfall is to forget subscription services, software licenses, or even annual regulatory fees that, when annualized, can add up.
Determining Per-Unit Revenue
Next, establish the average selling price per unit of your product or service. If you offer multiple products with varying prices, you might need to calculate a weighted average or perform separate break-even analyses for each product line. For service-based businesses, the next step could be the average price of a service package or an hourly rate. Consistency in defining a “unit” is essential here.
Calculating Per-Unit Variable Costs
Carefully determine all costs directly associated with producing or delivering one unit. This includes raw materials, direct labor, packaging, and any other expenses that disappear if no units are produced. Be diligent in distinguishing these from fixed costs. For a restaurant, such expenses would include the cost of ingredients for one dish, the direct labor of the chef preparing that dish, and the packaging if it’s a takeout order.
Applying the Break-Even Formula
Once these key figures are determined, plug them into the formula: Break-Even Point (in Units) = Total Fixed Costs / (Per-Unit Revenue – Per-Unit Variable Costs). The result will be the number of units you need to sell to cover all your expenses. To find the Break-Even Point (in Revenue), you can multiply the break-even units by the per-unit revenue or use the alternative formula: Break-Even Point (in Revenue) = Total Fixed Costs / ((Per-Unit Revenue – Per-Unit Variable Costs) / Per-Unit Revenue), where the denominator is the contribution margin ratio.
The true power of break-even analysis extends beyond a single calculation. It’s a dynamic tool for exploring various “what-if” scenarios, enabling proactive planning and risk mitigation.
Impact of Price Changes
Consider the effect of increasing or decreasing your selling price. A higher price, assuming demand remains stable, will lower your break-even point, as each sale contributes more to covering fixed costs. Conversely, a lower price will require more sales to reach the break-even point. This analysis helps businesses gauge the elasticity of demand and its impact on profitability. A slight price increase might significantly improve profitability without causing a substantial drop in sales, thus reducing the break-even threshold.
Analyzing Cost Reductions
Break-even analysis can highlight the impact of efforts to reduce either fixed or variable costs. If a business can negotiate lower rent (a fixed cost) or find a more affordable supplier for raw materials (a variable cost), the break-even point will decrease, making it easier to achieve profitability. This provides a quantifiable incentive for cost-cutting initiatives. Quantifying how much fixed costs need to be reduced to hit a specific break-even target can guide operational efficiency initiatives.
Assessing Volume Fluctuations
Businesses can use break-even analysis to understand the implications of different sales volumes. What happens if sales drop by 10%? Will the business still be profitable? What minimum sales volume is absolutely essential for staying afloat? This foresight allows for contingency planning and helps businesses prepare for potential market downturns or seasonal variations. It helps establish a “safety margin”—the amount by which sales can fall before losses begin.
Introducing New Products or Services
When considering a new product line, break-even analysis can determine the sales volume required to make that new offering profitable. This helps in budgeting for marketing, production, and distribution and ensures that the new product aligns with the overall financial goals of the business. By conducting a separate break-even analysis for each new offering, businesses can avoid subsidizing unprofitable ventures with successful ones.